Nicholas Blair Software Engineer

Traffic Avoidance Using Bloom Filters

In this post I’ll describe a unique integration project and a means for improving overall throughput with traffic avoidance.

The project inspiring this post had a lower bound of five hundred inputs per second (1.8 million per hour) and and upper bound of several thousand inputs per second (10 million+ per hour).

Scenario

Imagine you have a typical service endpoint that provides a REST API. You’ve assuredly got a resource URL that looks like:

GET /resource/{id}

In this scenario, assume a very high difference in cardinality between the range of possible id inputs, and the id values you have actually stored in the service. For example, for every 1000 id values, you only have 1 stored.

Now imagine a client that wants to integrate with this service. This client is exposed to a range of inputs on the high end of the cardinality range and wants to issue GET requests to your resource to see what data you have for each.

Brute force

If we just write a simple HTTP client for this scenario, and blindly send GET requests for each id observed, what can we expect to happen?

Remember for every 1000 requests, you are going to see 999 404 responses and one single 200 response.

How quickly do you need to make those requests, and what is your average network latency?

If your average network latency is 1 millisecond, you can complete 1000 requests in 1 second. (This isn’t realistically possible, not even on localhost can you get this latency for an HTTP request that has to hit persistence).

Say each HTTP round trip takes 20 milliseconds. This would be extremely fast, intra-datacenter traffic. It now takes you 50 seconds to get all 1000 requests completed.

1000 requests though isn’t really a problem worth talking about. What if we had a client with 1 million ids to check?

1 million requests with a latency of 20 milliseconds now takes you 50,000 seconds - or almost 14 hours (single threaded*). And out of that 1 million requests, you got a measly 1000 successful requests and 999,000 404s.

That’s a lot of network noise for little data.

Problem

The problem here is that latency isn’t ever going away. Caching isn’t going to do anything to help here; the differential in cardinality (99+%) will be directly reflected in cache miss ratio. In fact it may make the scenario worse.

We need some way for the client to be a little smarter and avoid making so many HTTP requests.

Batching?

What about adding support in the endpoint for a “multi-get,” e.g. allow the client to request a collection of ids, returning a map-like structure of matching results?

On the endpoint, our API would have either a POST /resource requiring a JSON body containing an array of ids, or maybe GET /resource/{id}/.../{id}. You’ll want to constrain how many ids you can accept, with all sorts of constraints to think about (URL length, number of values in an in clause for persistence). You still will have really high miss rate, so lots of traffic and database work for low successful result rate.

On the client side, this can be pretty complicated to deal with. Say your client is event driven - now it has to save state, collect up a bunch of ids until we hit some threshold to trigger an HTTP request? What happens to the processing needed after the data is obtained? How do you defer/block further processing until we get a response back? Callbacks? More Events?

Batching our requests would cut down on the number of HTTP requests, but the side effects of implementing it - particularly on the client side - appear to be very complex.

Bloom filter

A bloom filter is a data structure with two core operations:

/**
 * Put an object in the structure
 */
void put(T object); 
/**
 * Is the object maybe in the structure? return true
 * Is the object definitely NOT in the structure? return false
 */ 
boolean mightContain(T object);

mightContain can help us here, and tell us that the id is:

  • definitely not present, and we shouldn’t bother making an HTTP request, or,
  • might be present and we should try the HTTP request.

If the service had a way to distribute a bloom filter populated with the id values that we have persisted, a client could check the filter first before making a get:

if (bloomFilter.mightContain(id)) {
  return httpClient.get(id);
} else {
  return null;
}

This seems more promising: bloom filters are relatively easy to work with, it has the potential to achievethe desired effect of cutting down the number of HTTP requests the client makes.

Building a bloom filter

Google’s Guava provides an easy to use bloom filter implementation, that even includes writeTo and readFrom methods to allow us to serialize our filter on the wire.

Guava’s bloom filter implementation also has 2 parameters: expectedInsertions(int) representing roughly how big of a data set you plan to contain in the filter, and falsePositivePercentage(double) representing what percentage of false positives for mightContain(T) you are willing to tolerate. The lower falsePositivePercentage is:

  • the fewer HTTP requests you’ll have to make, but
  • the larger your bloom filter will be.

Within your service endpoint, you are going to need a way to pull all ids from your persistence periodically. In a previous post, I presented a technique for doing this with Apache Cassandra.

Experiment

I’ve implemented a Dropwizard endpoint in my code-examples project along with a client that demonstrates the concepts:

In Cassandra, I’ve stored ~620,000 records. With that dataset, a bloom filter containing UUID-like Strings had size of:

  • ~450KB with 3% false positive percentage
  • ~600KB with 1% false positive percentage

The bloom filter takes about 30 seconds to generate (running on a consumer grade desktop with a spinning disk that’s a few years old).

I’ve created an integration test to demonstrate the impact of traffic avoidance via the bloom filter can have.

Running this test produces the following:

[main] INFO BloomFilterDemonstrationIntegrationTest - client with filter skipped 46853 gets, made 3147 unsuccessful gets (filter false positives), 1 successful get, in 3.858 s
[main] INFO BloomFilterDemonstrationIntegrationTest - client without filter executed 50001 total gets, with 1 successful get, in 36.55 s

With the bloom filter present, we only sent HTTP traffic for ~3000 of the 50,000 IDs - meaning we avoided 94% of the HTTP traffic!

If we run the test again with a 1% false positive percentage on the bloom filter, we avoid 97% of the traffic.

Summary

Translating the experimental results back to our original problem:

In a scenario with a high miss rate, using a bloom filter allows us to avoid issuing ~95% of our client side reads. With the configuration shown, our client only issues 30,000 to 60,000 HTTP requests per million resource ids we observe on the client side.

I estimate we can store about 1,000,000 ids (UUID-like Strings) per megabyte (MB) of bloom filter at 1% false positives; that number goes to 1,300,000 at 3%.

One side effect to understand with this strategy is that it may be possible for the following sequence:

  1. Client downloads bloom filter, id X not present.
  2. Resource with id X created (some nonzero time later)

mightContain(X) is likely to return false. It could return true depending on where X is in the id range and how X is hashed by the filter, but we can’t count on that.

Using this strategy comes with the drawback that the freshness of the data observable on the client is directly related to the last time the filter was built. Adjust the frequency of filter construction/dissemination to match your data liveliness requirements.

Addendum

* Sure, we can parallelize this. 14 threads, down to 1 hour; 56 threads, down to 15 minutes. Do you have the capacity on both sides to deal with all that CPU? Database I/O for empty reads?
Perform a full table scan with Apache Cassandra

In this post I’ll talk about a technique for performing the equivalent of the following query with Apache Cassandra:

select * from mytable;

Now, in general, this is a bad idea. Apache Cassandra is an amazing data store, allowing you to persist billions or trillions of rows in a single table, all while still guaranteeing constant* time performance. But if you try to execute this query blindly it generally won’t work; the command may never return, and likely, crush your cluster in the interim.

If you need to scan through a large dataset like this, you should consider using something like Apache Spark. Spark has tight integration with Cassandra and can be deployed alongside your Cassandra nodes for efficiency and performance.

In this post, I’m not going to try and duplicate what you can do with Spark. This post will however, provide you a mixin interface you can use with just the DataStax Java Driver to scan the full table in a fairly sensible way that will complete.

Technique

This post describes the use of the token function:

Scanning the entire cassandra column family with CQL

The token function allows us to interact with the partitioning done by Cassandra. To satisfy our goal of observing every row, we can perform a series of limited sub-queries by token ranges.

These sub-queries look like:

select id/*primary key*/, ..., token(id) 
  from mytable 
  where token(id) >= -9223372036854775808
  limit 10000;

We take the token(id) value from the last row in the result set and run the query again, using that value + 1, until we get no more results. The results will always be returned in ascending order by token - that’s just how Cassandra’s partitioning works.

Each of these sub-queries then can (most often) get be satisfied from a single partition/node.

Code

The code for the mixin can be found at:

https://github.com/nblair/code-examples/blob/master/datastax-java-driver-examples/src/main/java/examples/datastax/FullTableScan.java

There are 3 methods you will have to implement with this interface:

  /**
   *
   * @return the name of the table (column family) to query, must not be null
   */
  String table();

  /**
   *
   * @return a list containing the names of the columns that compose the partition key; must not be empty
   */
  List<String> partitionKeys();

  /**
   *
   * @param row a single row in the result set
   * @return a corresponding object that can be hydrated from the row, must not be null
   */
  T mapRow(Row row);

Additional behavior:

  • If your mapRow method needs to inspect additional columns other than what are provided by partitionKeys, override List<String> columns().
  • The tableScan method will default to using the current keyspace for the provided Session. You can override String keyspace() to change this behavior.
  • The tableScan will limit the token sub-queries to 10,000 rows by default; override int limit() to change this. Use with caution.
  • The default CONSISTENCY for the query is ONE, which is the lowest consistency but highest availability. Trade off for performance; trying to do this with high consistency with large data sets is probably a worse idea, use with caution.

The containing module for this class contains a reference use case and an integration test to experiment.

References

Other references:

Addendum

* Inserts yes; Selects yes if you include the partition key in your where clause.

Outages Design Review

Here are slides from a design review I am presenting on Friday, October 28 2016:

Outages Design Review

This presentation is being given at the biweekly “Application Design Review Brown Bags” series, which is a community of practice at UW-Madison that gives IT professionals from across the university a chance to collaborate and share best practices.

There are three choices that we made during the outages that I’d like to highlight here.

Persistence implementation under an interface

Our first choice for persistence didn’t pan out. Since the initial persistence layer was guarded by an interface, we could quickly pivot to a different local persistence library in a really short amount of time with little disruption to the project. I expect switching to another implementation in the future to be just as straightforward.

Additionally - not removing the original persistence implementation when we added the new implementation was important. We could ship the release containing the new code without the necessary new configuration in place, and the application would run just fine. We could then experiment with the new configuration and easily rollback to the prior configuration without having to deploy a different release.

Every contribution is a release

We have a Jenkins job configured to participate in pull requests. After attempting to merge the branch, before running the build, it runs a gradle task to check that the version field has been updated using a Gradle plugin described in the post ‘Automating Release Management with Gradle and Jenkins’. If the version hasn’t been updated, the build fails.

Once passing, as soon as a pull request is merged, a release of the product is prepared automatically (see ‘Have Jenkins Tag your Releases’) and sent to the test environment. Developers don’t have to stop to prepare the release or think about manually deploying - it’s just done automatically.

Product Owner access to deployment pipeline

Allowing the Product Owner the ability to trigger deployments has been very successful. It’s often the case that by the time testing is complete and releases are scheduled, the development team has long since switched contexts to a different product in our portfolio. Having to steal capacity from another project’s time to perform production deployments is problematic.

What we’ve done for outages using the Jenkins Pipeline Plugin really avoids that resource capacity issue. We do this with confidence too, as rolling back to any prior version is just as easy and accessible to the product owner as well.

These three choices stand out in my opinion as patterns to follow in other current and future projects.

Integrated Applications Activity, March 2016 - October 2016

This is a report I produce every 6 months to take a look at the activity of my team. For additional background, see the first article on Visualizing Collaborative Development.

Here is the output from Gource on the combined activity across 178(!) projects between March 2016 and October 2016:

Notes

  • Our group name changed during this period from Internal Applications to Integrated Applications.
  • Techstore (PHP) and Enrollment Tools (Java) have the deepest trees. The teams working on these projects haven’t changed any members over the last period, however their members do still contribute to other projects.
  • The Techstore project achieved a significant milestone during this time period: they are committed to deploying Magento 2.x and eliminated all Magento 1 assets from the project. This is demonstrated at the 39 second mark in the video, with a good portion of that tree disappearing.
  • The center point of the video is quite shallow has the highest diversity of participants. The projects represented in this code are shared libraries and smaller applications.
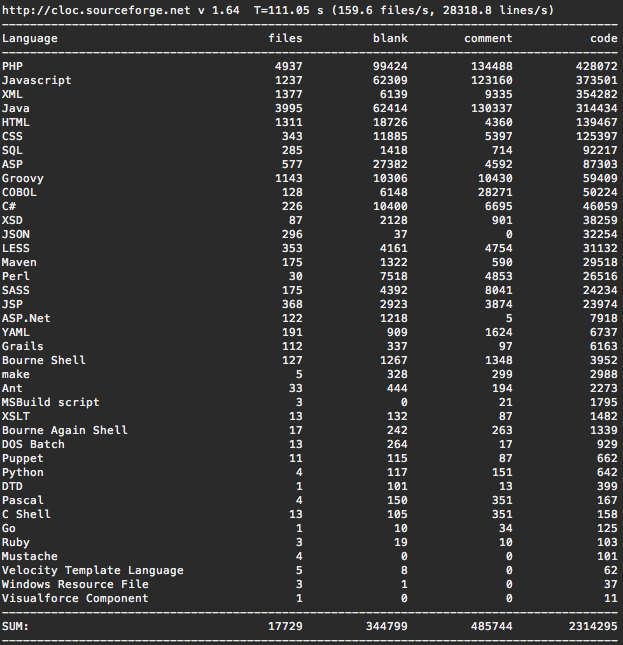
  • Our project count is up to almost 180 different repositories. A casual invocation of cloc on the work directory used to produce this video suggests there are over 2.3 million lines of code in total:

Screenshot of cloc output

And yes - the COBOL code is really there and actively maintained!

Takeaways

  • There are many participants shown in the video that are not actual members of Integrated Applications, but rather are members of peer groups both within DoIT and other campus groups. This is a great thing.
  • There is a lot more PHP in the portfolio than I expected. There are less than 10 PHP projects in the portfolio, but what projects we do have in the technology are very large.
  • I did exclude one git repository from the cloc output as it contained a full wordpress install (including it pushed the total to over 3 million, with twice the lines of PHP).

The source material used to create this video can be found at https://github.com/nblair/internal-apps-visualization.

Have Jenkins Tag your Releases

In this post I’ll describe a short script to help Jenkins make git tags and push them to your repository.

This technique pairs really well with a previous post titled Automating Release Management with Gradle and Jenkins.

Configure your build to write out the build version

This step is a little tricky, as it depends on the shape of our project and the plugins you use to build it.

Here’s the context:

  • Something has just finished running your build.
  • Some step in the build wrote the build version to a file in the build result.

There are a lot of ways to do the latter with Gradle. An simple example would be to include this configuration for the jar (or war) Task:

jar {
  manifest {
    attributes(
      'Implementation-Title': project.name,
      'Implementation-Version': project.version
    )
  }
}

Alternatively, if you are using Spring Boot, you could also include the following in your application.yml:

info.release.version: ${version}

And the following in build.gradle:

processResources {
    filesMatching('application.yml') {
        expand(project.properties)
    }
}

Lastly, you could also use the gradle-git-properties plugin, which is useful if you want to include the same project build information in response to GET /info (if you have the ‘info’ Spring Boot Actuator endpoint enabled, see the Spring Boot reference manual).

Read the version and tell Jenkins

Now that your build result has something on the filesystem containing the build version, you can extract it with a little Groovy code:

(That script assumes you are using the MANIFEST approach, see this gist for the Spring Boot/application.yml approach.)

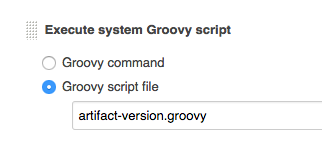
Add this groovy script as a Build step, after your main build step:

Build step

Tag and push

Last but not least we need to configure a post build step using the Git Plugin.

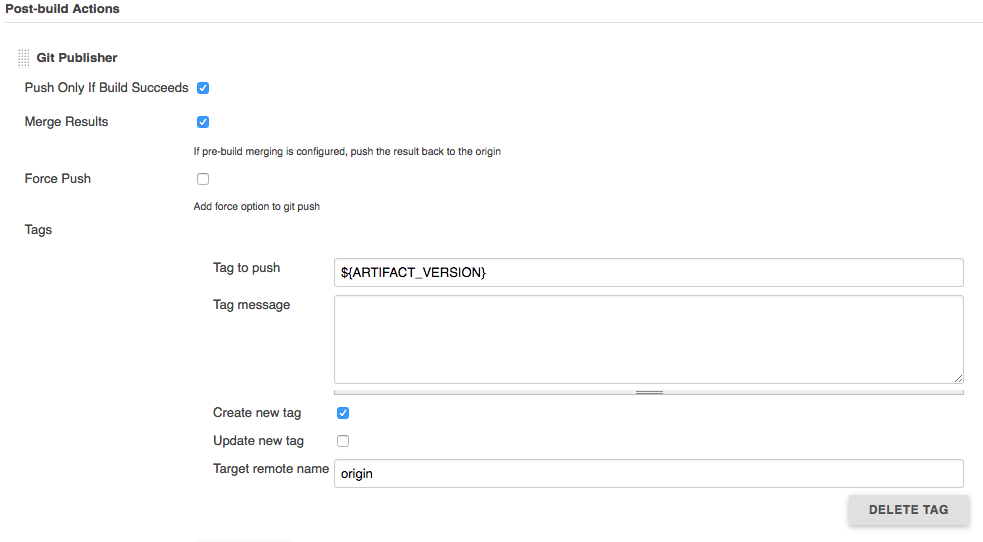
Under Post-build Actions, click Add Post Build Action, and select Git Publisher. In the Tags block, click Add tag. The Tag to push input should contain ${ARTIFACT_VERSION}, which is the environment variable we set by the groovy script.

Here’s a screenshot of the final configuration:

Build step

That’s it! Using this approach with Automating Release Management with Gradle and Jenkins results in all of your contributions being release-ready - without having to even consider publishing -SNAPSHOT builds.